What Reports Are Important in the Home Service Industry?
Do you ever struggle knowing what KPIs to track? Sometimes you have all the data in front of you, but what is this data really telling you? When using a sales tool, here are some of the Essential Reports you want to check on regularly and why they can be helpful to your business whether just starting out, or you are a seasoned pro!
Lead Source Reporting
Number of Leads
This metric helps you understand how many potential customers are coming in from each lead source. A high volume of leads from a particular source might indicate strong brand awareness or effective marketing strategies.
Percentage of Leads
This shows the proportion of leads each source contributes to your overall lead pool. It helps you gauge the relative importance of different lead sources and prioritize them accordingly.
Close Rate
The close rate indicates the percentage of leads from each source that convert into paying customers. A higher close rate suggests that leads from that source are more qualified or that your sales process aligns well with customers coming from that channel.
Average Ticket
This metric shows the average revenue generated per lead that converts into a sale. It’s particularly useful for understanding which lead sources bring in high-value customers, allowing you to focus on the most profitable channels.
Total Revenue Booked
Total revenue booked from each lead source helps you see the direct financial impact of each channel. This metric is crucial for assessing the overall effectiveness of your marketing efforts and ensuring that your resources are being allocated to the most profitable sources.
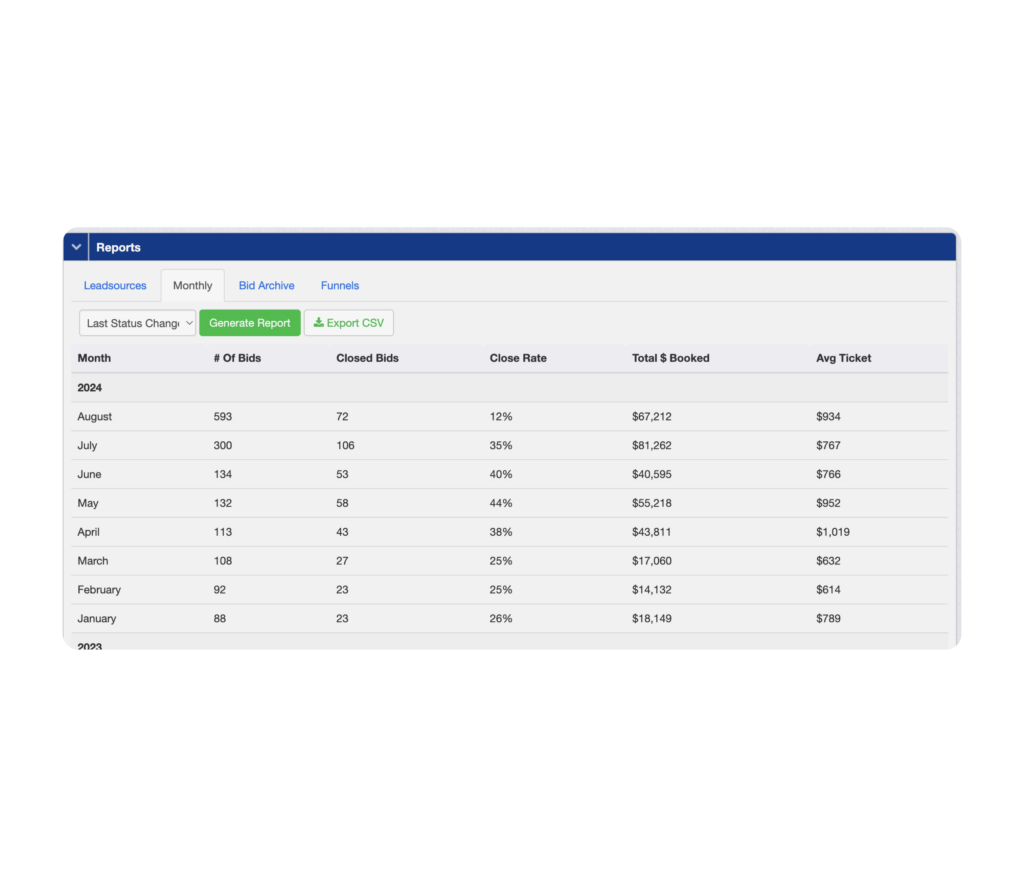
Monthly Metrics
Tracking those same metrics not only by lead source, but each total on a monthly basis can also help your business, here is what monthly reports can tell you;
Performance Trends Over Time
By monitoring these metrics month over month, you can identify trends in your sales performance, helping you understand whether your business is growing, stagnating, or declining. If you notice a consistent increase in the number of bids but a drop in the close rate, it may indicate that your lead quality is declining or your sales approach needs adjustment.
Seasonality Insights
Monthly tracking allows you to see seasonal patterns in your business, helping you prepare for peak and off-peak periods. You may observe a spike in closed bids and total revenue during specific months, you can allocate more resources to those periods to maximize revenue.
Resource Allocation
Understanding which months have higher average tickets and close rates enables you to allocate your marketing and sales efforts more effectively. You might decide to increase advertising spend in months with historically high close rates to capitalize on higher conversion potential.
Goal Setting and Forecasting
Tracking these metrics on a monthly basis provides a solid foundation for setting realistic goals and forecasting future performance. If your total revenue booked has been steadily increasing, you can set higher revenue targets for the coming months.
Identifying Issues Quickly
Regular monitoring helps you quickly spot any issues, such as a sudden drop in the close rate or a decline in average ticket size, allowing for prompt corrective action.
If total revenue booked suddenly decreases despite a consistent number of bids, it could indicate a pricing issue or a change in customer behavior.
Optimizing Sales Strategies
Monthly insights help you refine your sales strategies based on what’s working best at different times of the year. If you find that your close rate is highest when you offer discounts or promotions, you might decide to make such offers a more regular part of your sales strategy.